The Importance of Graphs and Charts in Forex Trading
Essentially, graphs and charts equip traders with historical data that may be used to forecast future price movements. The fact that most forex brokers offer forex charting software free of charge to clients with active and funded trading accounts should give newbies an indicator of how important it is to forex trading success. Like stock charts, forex charts help with technical analysis by displaying data pertinent to a currency pair.
Understanding forex charts
Due to their ability to identify patterns, forex charts are crucial tools for traders who seek to use technical analysis when trading currency. The popular platform tradingview offers a wide range of charting tools and indicators that aid in visualizing and analyzing price movements. According to this school of thought, the supply and demand of a security market determines its short-term price fluctuations. As a result, the technical analysis community, including TradingView users, emphasizes the equilibrium between buyers and sellers more than the asset’s underlying fundamentals.
Advantages of using charts when trading forex
There are several types of forex charts, each with advantages and disadvantages and a few common characteristics. Among the many benefits of employing forex charts include:
Technical analysis
One of the most important reasons to learn how to read a chart correctly is to be able to use technical analysis. Not all traders advocate technical analysis, but it can be valuable even if it is not your primary strategy. The price data on the chart you’re utilizing is essential to the success of your technical analysis. Most charting packages allow you to add technical analysis tools as overlays to your chart.
Easily available
The availability of forex trading charts on the Internet is the first and most obvious benefit of using them. You can find accurate and complete forex charts online with little more effort than it takes to look up the term “forex.” The best part is that you can get most of them without spending a dime. Because of this, analyzing forex charts and performing technical analysis is a time and money saver.
Fewer distortions
The asset’s price is the primary input for most technical analyses. Since there is only one dependent variable, there is less possibility for potentially confounding factors. Forex charts, in a nutshell, accurately reflect the historical performance of a given currency pair. Using merely the market price, you may quickly determine what other factors influenced the currency’s value at a given period.
Objective decision making
Using charts, investors can make decisions in an organized and unbiased manner. Traders can remove their emotions from their trading selections and make more evidence-based choices when accessing past price data. Technical analysis gives traders an edge by providing information such as
Timing and entry points: Traders can maximize profits and reduce losses by entering a trade at the optimal time, which can be determined by analyzing price patterns and technical indicators.
Support and resistance levels: Traders can place stop-loss orders at essential support and resistance levels. Furthermore, technical analysis assists traders in determining the proper position size and leverage for each trade, ensuring sensible risk management.
Confirmation of fundamental analysis: Traders can improve their chances of making profitable trades by employing technical analysis to confirm the signals given by fundamental analysis.
Different types of forex trading charts
The primary purpose of any chart is to assist you in making educated decisions about whether or not to buy or sell a security. A chart displays the results of a single trading session (10 minutes, 4 hours, a single day, or a whole week). For analysis, a chart can be constructed for any financial asset for which price data is available over time.
The graph’s x-axis (horizontal axis) shows time, while the y-axis (vertical axis) shows the price. The chart displays prices as they rise from left to right. The most recent price is shown on the far right.
Candlestick charts
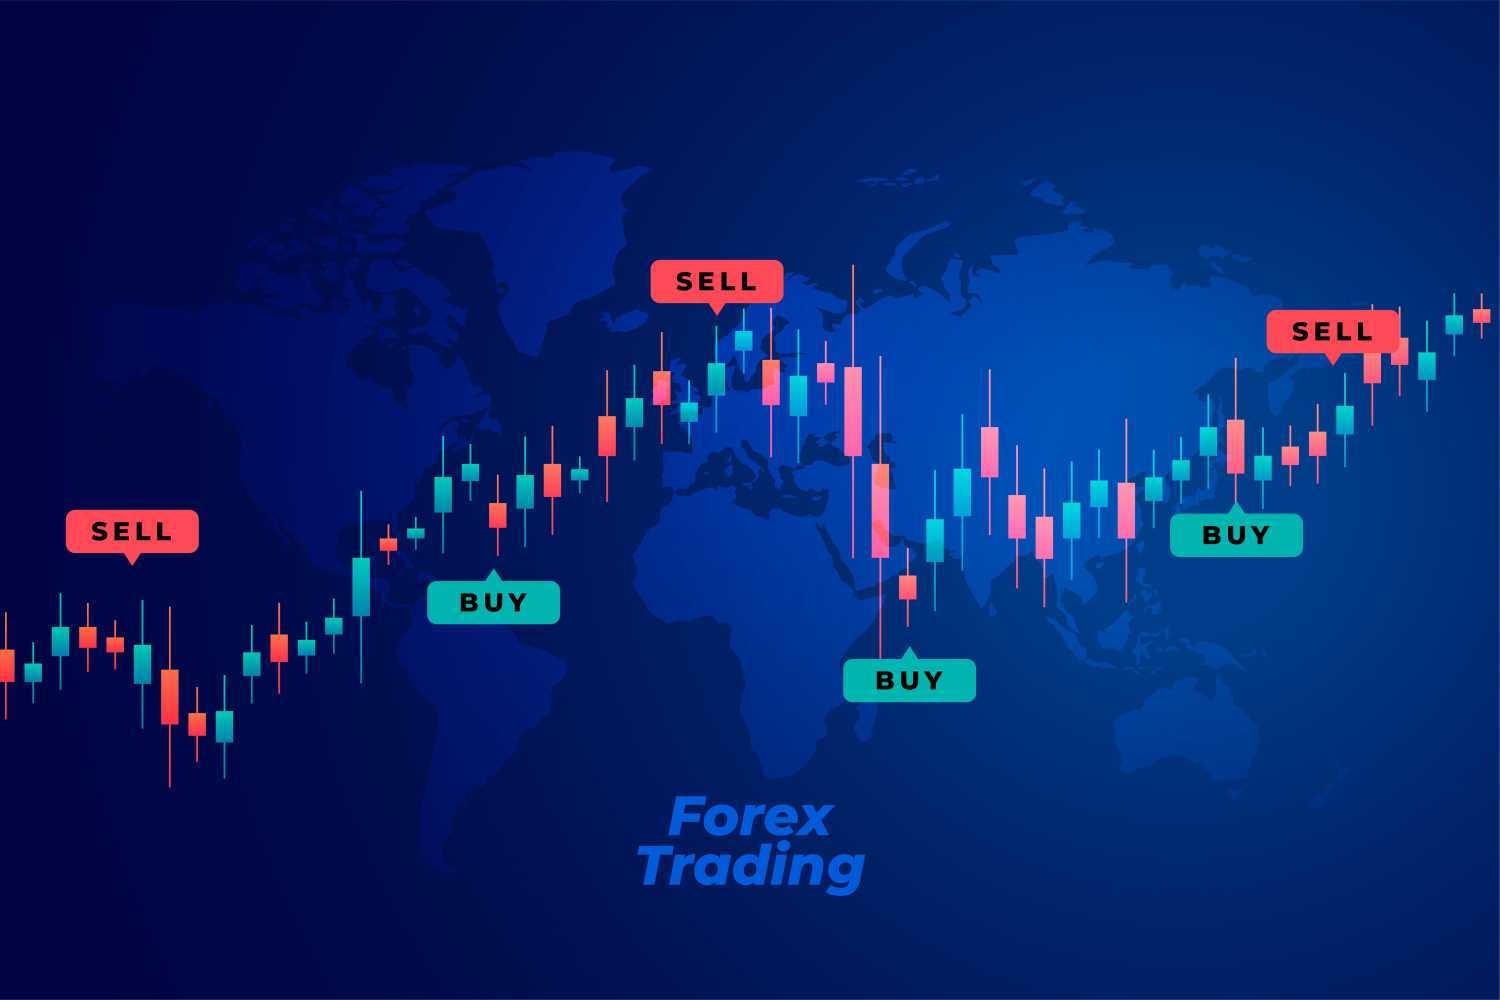
Forex traders frequently make use of candlestick charts as a means of displaying market data. They help investors locate the day’s highs and lows with precision. They can also use the chart to anticipate the most likely market trend.
Candlesticks were first employed by Japanese rice traders hundreds of years ago to keep track of fluctuating market values. These charts eventually gained traction in the States. They’re superior to bar and line graphs in accuracy and readability.
A candlestick is made out of a hollow body with a wick at both the top and bottom. A long candlestick represents strong buying or selling pressure, whereas a short one indicates low volume. The length of the wick will change throughout the day as prices fluctuate.
Line charts
Line charts in forex trading offer a straightforward, uncomplicated view of the market. You can use them to find trend lines and significant support and resistance levels. They also help investors ignore irrelevant market data.
The primary benefit of line charts is the ease with which analysis may be performed. They are beginner-friendly due to their simplicity. However, they need to provide more information regarding how prices changed within that time.
Another issue is that there need to be more extreme points on the chart. That’s why lots of traders choose bar charts. However, they do include extra data beyond just opening and closing prices.
Bar charts
Forex traders frequently utilize bar charts. They provide a wealth of data for each trading period, making them ideal for recognizing trends and patterns.
The opening and closing prices are the most significant parts of a bar chart. A thin horizontal line at the left end of a vertical bar represents the opening price. A similar line on the right side of the vertical bar represents the closing price.
One of the most common kinds of bar charts is the vertical bar. This is because it accurately depicts the trade spread between two currencies. The foreign exchange market’s most widely used bar durations are four hours, one hour, and fifteen minutes.
The 7.5 trillion dollar market is a complex and ever-changing landscape where accurate and timely analysis is the key to success. Graphs and charts provide traders with invaluable insights, allowing them to visualize price movements, identify patterns, and make well-informed decisions.
Traders can effectively track currency price movements over time by learning to interpret various charts, such as line charts, bar charts, and candlestick charts. These visual representations help traders recognize trends, support and resistance levels, and potential entry and exit points, enhancing their ability to devise sound trading strategies.
- House or Business First? A Smart Financial Guide to Building Wealth - July 13, 2026
- Fire Insurance for Small Businesses in the Philippines - July 11, 2026
- How to Increase Your Loan Approval in the Philippines - July 8, 2026